PostgreSQL Job Logging & Monitor Extension – The Monitor
Following up to my post last month about pg_jobmon’s logging capability, this post will discuss its ability to let you monitor your jobs’ statuses. Like last month, I will again be assuming you’ve installed pg_jobmon to the jobmon schema.
The Monitoring Function
The main function that’s used to monitor logged jobs is check_job_status(interval). It returns row output, so it can easily be used as a query for monitoring software (more on that later). The interval argument is used to tell the function how far back to go when checking the job logs. To help the function run faster, this should be not much greater than the longest interval between any job that is listed in job_check_config (see below). For example, if you’re monitoring a special job that is run weekly, and nothing you’re monitoring runs with any greater interval of time (bi-weekly, monthly, etc), then you should call
db=# select * from jobmon.check_job_status('8 days');
 alert_code |         alert_text
------------+-----------------------------
          1 | (All jobs run successfully)
I didn’t give it a strict ‘1 week’ interval just to give it a little buffer time. The above is what should be returned if everything is running fine. If not, the alert_text column will contain a list of all the jobs that returned either alert code 2 or 3. The alert_code field is the primary means of communicating the status of running jobs in the database. Use this in combination with the alert_code column in job_status_text to get a plaintext meaning to the code. As I noted last month, pg_jobmon uses three error codes to express the associated alert levels. The logger functions will use the alert_text values to update the status columns in job_log when a job is closed either successfully or failed.
alert_code | alert_text
------------+------------
          1 | OK
          2 | WARNING
          3 | CRITICAL
Setup
By default, any job that has failed to run 3 consecutive times will cause the above function to return alert_code 3. There’s no additional setup to do if that sort of monitoring will work for your situation. If you need any sort of alerting other than that, you can use the job_check_config table to set that up.
Table "jobmon.job_check_config"
     Column      |   Type   |       Modifiers
-----------------+----------+------------------------
 job_name        | text     | not null
 warn_threshold  | interval | not null
 error_threshold | interval | not null
 active          | boolean  | not null default fals
 sensitivity     | smallint | not null default 0
Only one line needs to be added to this table for each job that needs different alerting criteria.
- job_name – This is the EXACT job name as it appears in the job_log table. It is case sensitive, so jobs entered here should be in all caps. Easiest thing to do is just copy the job name right from the job_log table.
- warn_threshold – This is the interval of time that can pass without the job running before alert_code 2 is returned by check_job_status()
- error_threshold – This is the interval of time that can pass without the job running before alert_code 3 is returned by check_job_status()
- active – Set this to TRUE if you want check_job_status() to actively monitor this job. Set to FALSE to disable checking without removing the data from the config table
- sensitivity – This is the number of times the job can fail (status column in job_log is the text value of alert_code 3, CRITICAL by default) before alert_code 3 is returned by check_job_status(). Note that if you want this to return immediately on the first failure, set it to zero, not one.
The threshold times use the end_time column value from the job_log table to determine when that job last ran successfully. That means a job will have to have run successfully at least once for check_job_status() to return an all clear. This is why the default value for active is false, to avoid accidentally setting off an alert for a new job you just added to the monitor.
Here’s an example of one that runs once a day and should return alert 2 if not finished within 2 hours of its last run time and alert 3 if not run within 3 hours. Also a single failure of this job will cause the next run of check_job_status() to return alert_code 3 along with the failing job’s name.
-[ RECORD 4 ]---+----------------------------------------------------
job_name        | GET_ACTIVE_DATA
warn_threshold  | 26:00:00
error_threshold | 27:00:00
active          | t
sensitivity     | 0
Here’s an example of what a call to check_job_status() returns if a job hasn’t run in its expected timeframe
db=# select * from jobmon.check_job_status('3 days');
-[ RECORD 1 ]-----------------------------------------------------------------------------------------------------------
alert_code | 3
alert_text | (GET_ACTIVE_DATA: MISSING - Last run at 2012-07-17 16:42:03.342218-04; )
Third Party Monitoring Software
If you’ve used Nagios as your monitoring solution, the alert_text values probably looks familiar. This extension was designed initially for use in Nagios and kept its alert_text values from then. They seem to fit appropriately as defaults, and still work in our current monitoring software, so they were left like that. You’re free to update the job_status_text.alert_text values with whatever you wish, though, if your monitoring software needs something else.
The easiest way to get pg_jobmon working with Nagios is to use the check_postgres monitoring script. check_postgres has a custom_query option that works perfectly and already provides the output that Nagios needs. I’m not going to get into the finer details of configuring Nagios, but what follows are example command and service definitions that I’ve set up for my own system where Nagios and postgres run on the same machine. Adjust the paths and server values as needed for your systems.
define command {
    command_name        check_jobmon_status
    command_line        /home/nagios/bin/check_postgres_custom_query -u nagios --valtype=string --query="select t.alert_text as result, s.alert_text from jobmon.check_job_status('3 days'::interval) s join jobmon.job_status_text t on s.alert_code = t.alert_code" --dbhost=$HOSTADDRESS$ --warning=$ARG1$ --critical=$ARG2$ --dbname=$ARG3$,$ARG4$
define service {
    use                             local-service
    host_name                       localhost
    service_description             PG Jobmon Status Check
    check_command                   check_jobmon_status!WARNING!CRITICAL!dbname
}
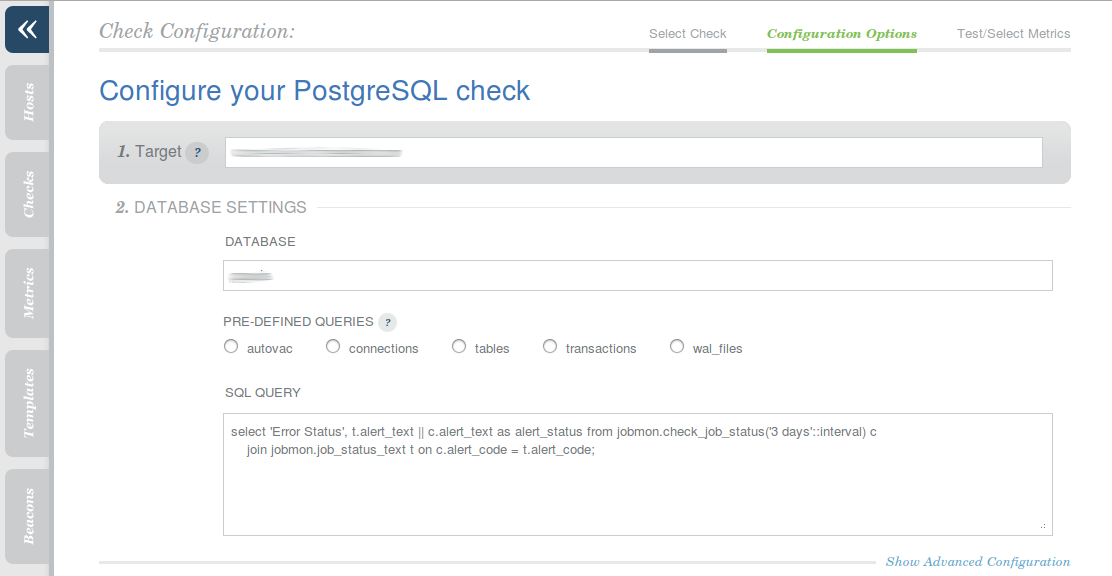
The other monitoring service that we use, and that this monitor is even easier to set up with, is Circonus. All you need to do is define a Check with a similar query that Nagios used (note the extra text value as the first select field)

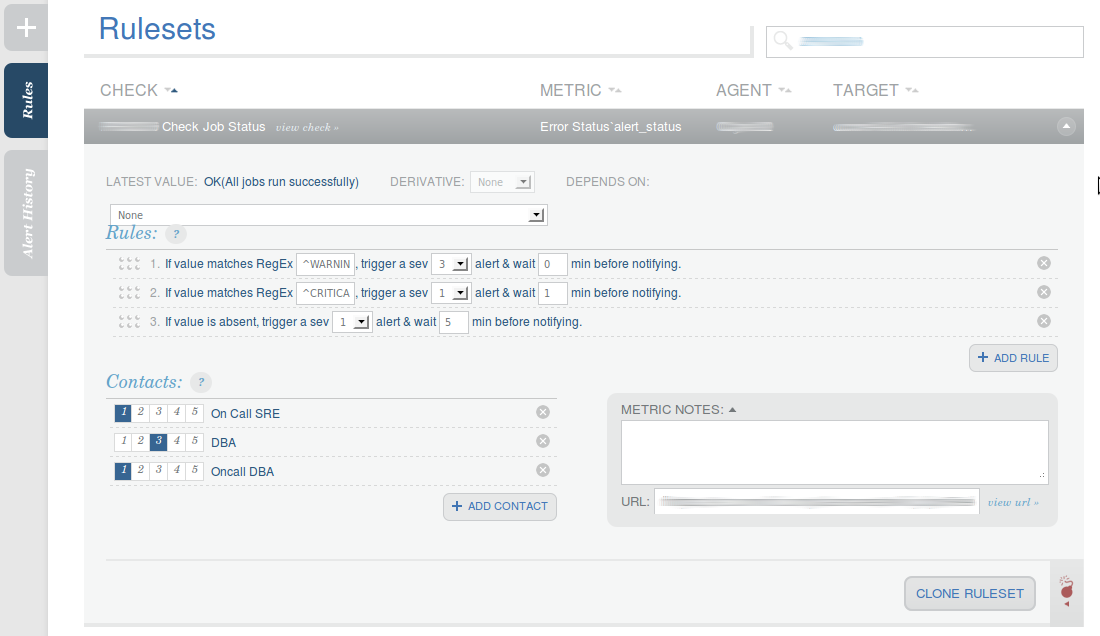
And then create a Rule using the regular expression matching options.

In the above image, the last returned value shows the full text result of running the query. So if there are several jobs that have failed, they will all show up in the Circonus alert that is sent out. For us, Severity 3 just sends an email out to the DBA team, so we can try and fix things before actually setting a page off. Sev 1 alerts both our on-call DBA and the on-call Sys Admin.
As I said before, the logging portion of this extension has been in existence for a while in several forms across different systems, so it’s pretty stable and probably won’t change too much in the near future. This extension is an attempt to bring some consistency and ease of maintenance across the systems we manage. The only thing I can see making a big impact in its design is if PostgreSQL actually gets built in autonomous functions. The monitoring portion is fairly new, and I’m hoping to find ways to make it more useful, but it seems to be working well so far in both the monitoring software packages I’ve tried it in. For either portion, I’m more than open to ideas and the code is always available for anyone to play with and contribute back.